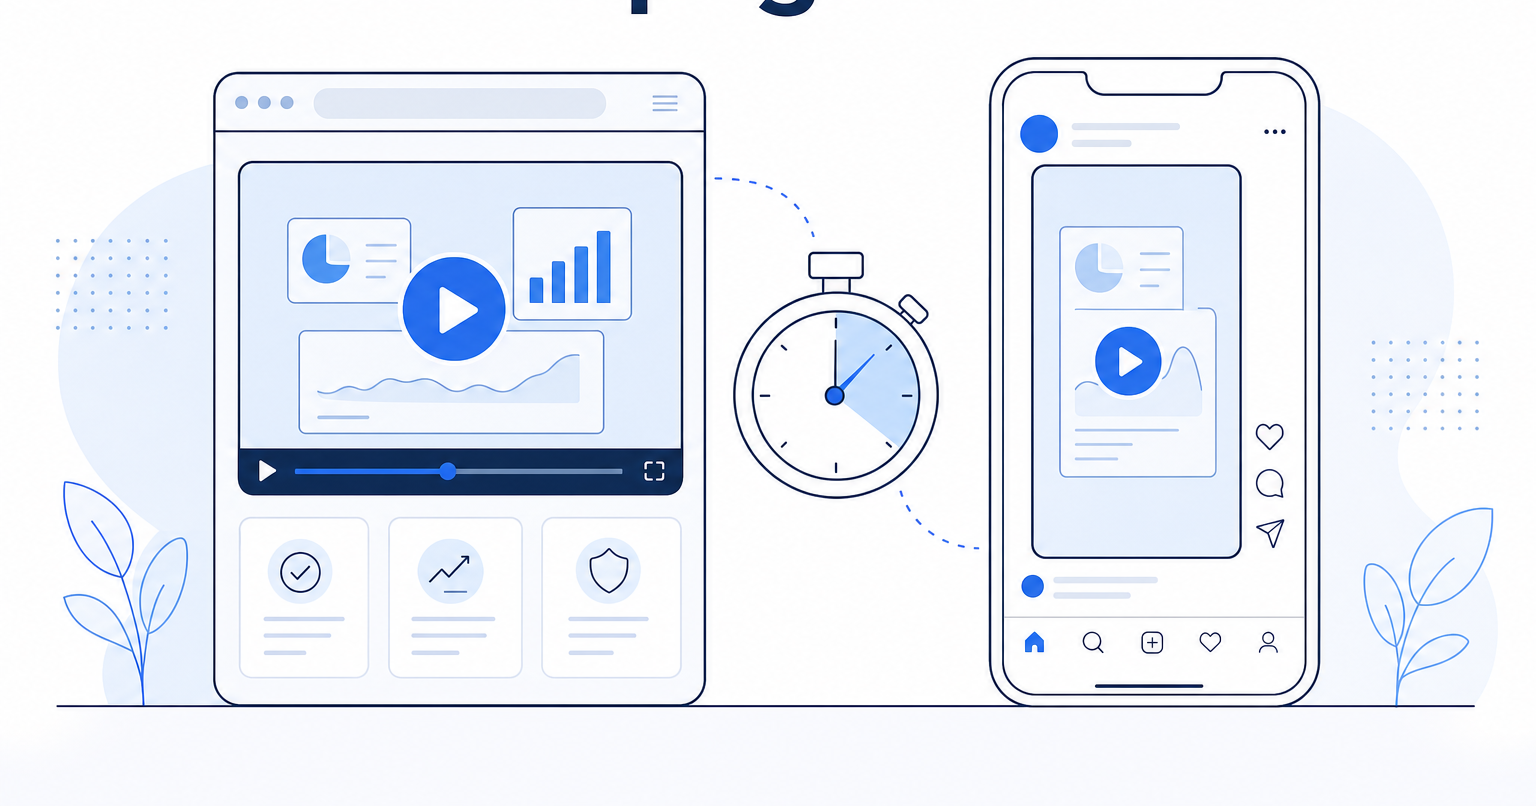
The short answer: you measure SaaS video ROI by tying each video to a specific business outcome (pipeline created, trial signups, demo conversions, support ticket deflection, sales cycle compression), then comparing the lift it produced against its fully loaded cost over a fixed window, usually 90 to 180 days. Anything else is vanity.
Most SaaS teams get this wrong because they grade video by views and watch time, then wonder why finance pushes back at the next budget cycle. Views do not pay payroll. Below is the framework we use with clients, broken into the five layers that actually matter when a CFO asks whether the video line item earned its keep.
Start by Assigning Every Video a Single Job
A homepage explainer, a feature walkthrough, a customer story, and a podcast episode all measure differently because they exist for different reasons. Before you can calculate ROI, write down the one job each asset has to do.
- Homepage explainer: lift visitor to trial or demo conversion rate.
- Feature walkthrough: reduce time to activation for new users.
- Customer story: accelerate mid-funnel deals (proposal to close).
- Sales enablement clip: shorten the sales cycle or increase win rate.
- Podcast episode: generate qualified pipeline through community and brand.
- Support video: deflect tickets and reduce CS load.
This sounds obvious, but it is the step almost every team skips. A video without a single assigned job cannot fail, which means it cannot succeed either.
The Five Layers of SaaS Video ROI
1. Direct conversion lift
The cleanest measurement. Run an A/B test on the page where the video lives. For a homepage explainer, that means measuring trial or demo conversion with the video against a control without it. If your baseline is 3.1% and the video version converts at 4.4%, you have a 42% lift. Multiply that lift by your monthly qualified traffic and your average customer LTV, and you have a defensible number.
If you cannot A/B test (low traffic, single page), use a pre and post window of at least 60 days each and control for seasonality and paid spend changes.
2. Pipeline influence
Tag video views in your marketing automation and CRM. When a deal closes, look back at every touch. Influenced pipeline is not the same as sourced pipeline, but for mid-funnel assets (customer stories, ROI explainers, founder podcasts), influence is the right metric. A reasonable target: video should touch 40% or more of closed-won deals within two quarters of launch.
3. Activation and retention
For product-led SaaS, the highest-leverage videos often live inside the product. A 90-second walkthrough placed at the right onboarding step can lift day-7 activation by double digits. Track it the same way you would any onboarding experiment: cohort users who saw the video, cohort users who did not, measure activation rate and 30-day retention.
4. Sales cycle compression
Give your AEs three customer story videos and track average days from demo to close before and after. If the cycle drops from 47 days to 39 days, that is real money. Shorter cycles mean more deals per rep per quarter without hiring.
5. Support deflection
Often forgotten in ROI conversations. A clear video answering the top five support tickets can deflect a meaningful percentage of contacts. Multiply deflected tickets by your average cost per ticket and you have hard savings, not a marketing metric.
What "Cost" Actually Includes
You cannot calculate return without honest cost. Include production fees, internal time (PM, subject expert interviews, reviews), paid distribution, hosting, and the cost of updates when your product UI changes. A $25,000 explainer that needs a $4,000 refresh every 18 months is a $29,000 asset, not a $25,000 one. Our breakdown of what determines the cost of a SaaS explainer video walks through the real line items.
Realistic Benchmarks to Anchor Expectations
A few numbers worth holding in your head when you build a model:
- Homepage explainer: 20% to 50% conversion lift is common for SaaS pages where the product needs explanation. If your product is genuinely self-evident, the lift is smaller.
- Customer story: measurable influence on 25% to 40% of mid-funnel deals when used by sales.
- Onboarding video: 10% to 20% activation lift at the step it lives on.
- Payback window: a well-targeted explainer typically pays for itself in 4 to 9 months for B2B SaaS with average ACV above $10,000.
These ranges come from the work we do. Your numbers will differ based on traffic, ACV, and how disciplined the rollout is.
How to Build the Model in a Spreadsheet
Five columns: asset, job, baseline metric, post-launch metric, dollar value of the delta. Sum the right column. Subtract fully loaded cost. That is ROI. The spreadsheet does not need to be fancy. It needs to be honest about attribution windows and consistent quarter over quarter.
If you want a sounding board on which videos will move which numbers for your specific funnel, that is the conversation we have with most new clients before any camera turns on. You can see how we think about it on our strategy page, or browse explainer video work to see the assets these metrics apply to.
Measure the right things, assign every video a job, and the budget conversation gets a lot easier.